Last time we reviewed current college costs and recent growth. Continuing with the theme, this post will be taking a look at longer history of tuition growth and how it compares with other indicators.
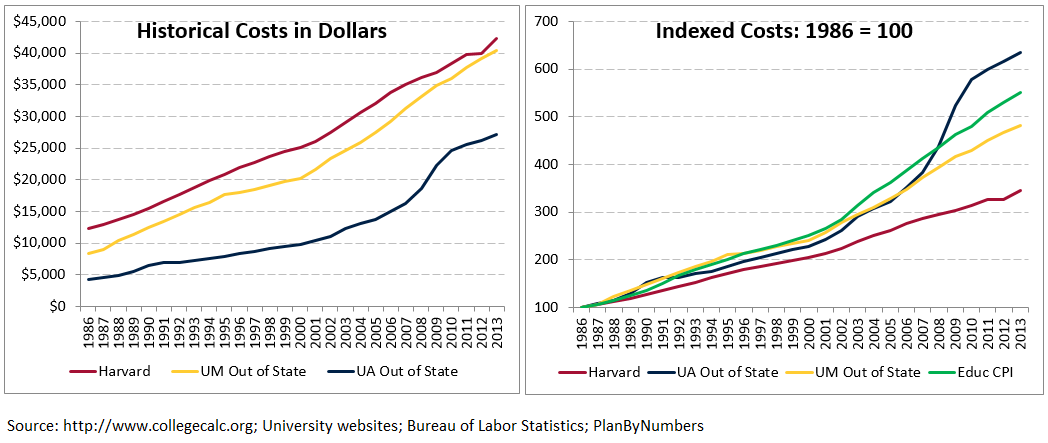
Exhibit 1 shows costs for selected schools. Once again, I’m picking on three schools: University of Michigan since it’s my Alma Mater (Go Blue!), University of Arizona as it is my adopted home school in Tucson (Go Cats!); and Harvard because, well, it’s Harvard! By the way, the lines on the chart use the official school colors with custom RGB settings: Harvard Crimson, Michigan Maze & Arizona Navy Blue – how is that for attention to detail!
The first panel of the chart shows costs in actual dollars. But the second panel is more interesting as it compares apples to apples and includes the “College Tuition and Fees” component of the CPI (consumer price index) from the Bureau of Labor Statistics. Basically, schools with lower starting price tags increased them at a faster pace to close the gap. The green line shows that since 1986 the average cost of attending four-year college has increased 5.5 times or 450%!
Exhibit 1
“So what”, you say, “inflation is a fact of life and our country has become much more prosperous since then!” Let us compare college inflation with overall CPI and median family income (Exhibit 2). We are using Median Family ages 45-54 since that’s a common age range for parents with kids in college. As you can see, the increase in college costs has outpaced the broader inflation and growth in family income by a factor of two. Even as income growth slowed to a crawl in 2000’s and 2010’s, the education inflation continued unabated. To drive the point home, look at ludicrous divergence in Exhibit 3 that puts those numbers in graphical form.
Exhibit 2

Exhibit 3

Source: Bureau of Labor Statistics; PlanByNumbers
Yet another way to look at it would be to compare college costs as a percent of median family income over time (Exhibit 4). In 1978, typical family would pay about 22% of their income to cover college costs including room and board. This was doable and most families were able to cover it from their cash flow. By 1995 that number has increased to 36% and then reached almost 60% by 2012. This has led to huge increase in student loans and created the entire 529 College Savings industry.
Exhibit 4

This situation is clearly not sustainable and the political will to address it is building. The Obama administration and congress are working on addressing the student loan debt and penalties for universities with large tuition increases. I suspect at some point the market forces will reign in the costs as the college value proposition becomes less clear. In the meantime, there are some early signs of moderating price increases in the last few years:
Exhibit 5

Source: Bureau of Labor Statistics; PlanByNumbers
In another post I plan on taking a look at whether the increased earnings for college graduates make up for the escalating tuition costs.
