There has been a lot of noise lately about small cap stocks underperforming their larger brethren. Sure enough, there is a perfect order to the hierarchy of returns on size ETFs in 2014 – the smaller they are the more they stink (Exhibit 1).
Exhibit 1 – YTD Performance by Market Cap
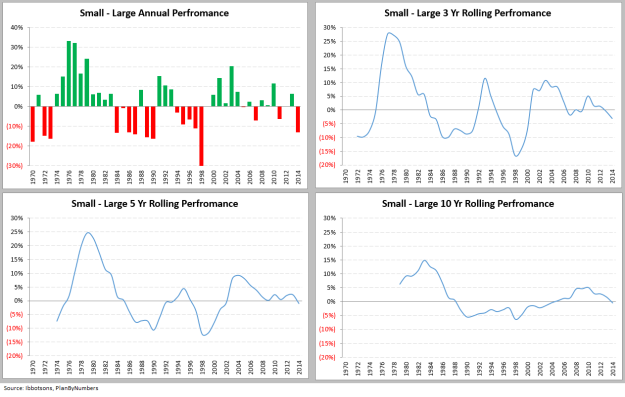
But just how unusual is that and what does it mean? Let’s look at historical performance patterns back to 1970 (Exhibit 2). Small caps had a period of massive outperformance from 1974 to 1983. Since then they have traded the lead back and forth. There are cyclical patterns that are obvious on the rolling performance charts below.
Exhibit 2 – Small Cap Relative to Large Cap
Breaking it down by decade (Exhibit 3) presents similarly mixed pattern. Small caps rocked it in 1970’s. They then did much better in the 2000’s as large companies worked off the tech bubble hangover. In the past 25 years (since 1990), the performance is exactly even albeit with slightly more volatility in the small cap.
Exhibit 3 – Average Returns by Decade
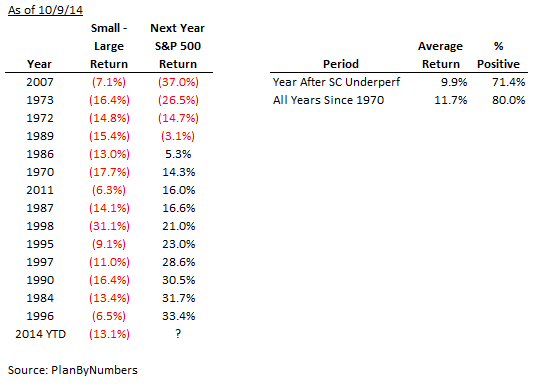
Ok, if these patterns are cyclical, can we make any predictions based on them? Exhibit 4 shows S&P 500 returns in the year following small cap underperformance of 5% or more. This metric “predicted” some of the biggest market drops including 2008 and 1974, but it “missed” several big ones. Furthermore, it also preceded some of the really good years for the S&P 500. In fact, the market was positive 71% of such years with an average return of 10%. Although, it should be noted that picking a random year since 1970 would have had a slightly better result.
Exhibit 4 – Market Returns After Years of Small Cap Underperformance
Conclusion
Like most things in the stock market, small cap underperformance is cyclical and quite common. There is no conclusive evidence that it has to lead to a big correction or end of the bull market. Perhaps the best we can say is: “2015 is likely to be a good year that is maybe possibly slightly less good than an average year”.
Data Note: Large Cap is represented by S&P 500, Small Cap is a spliced benchmark since Russell 2000 only goes back to 1980 (DFA US Small Cap Index 1970-1971, Ibbotson 1972-1979, Russell 2000 Index 1980-2014).


