I got some positive responses from the last post on monsoons in Tucson, so I decided to stay with the weather theme for one more late summer boondoggle. This time I reviewed trend in local temperature. The charts come straight from NOAA/National Weather Service website and I a present them as they are with limited personal comments.
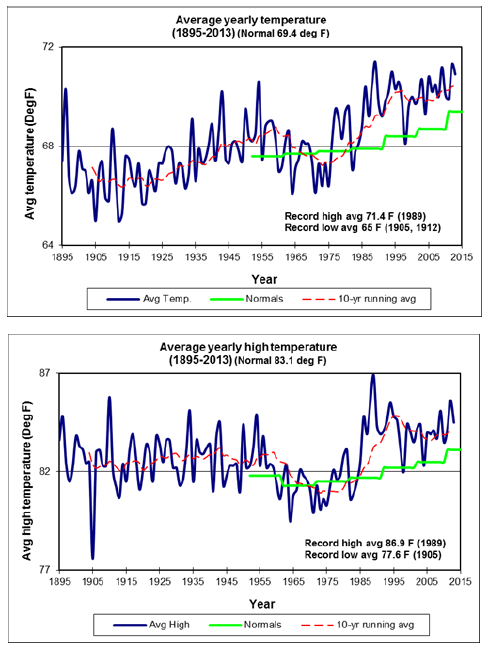
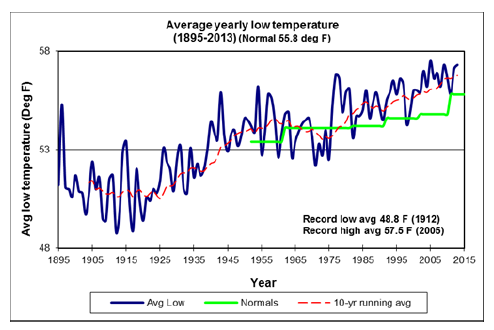
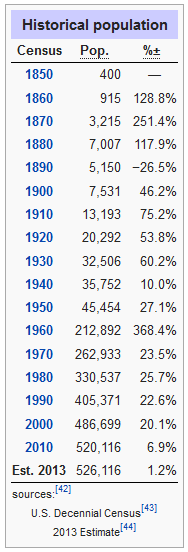
Exhibit 1 shows average yearly temperatures along with “normals” and 10 year moving averages. There has been a sustained increase in average temperatures since 1970s (panel 1). Interestingly though, high temps increased only slightly and majority of the trend can be accounted for by fast warming of the daily lows (panel 3). Undoubtedly, this must be related to the “urban heat island” phenomenon. More information of UHI can be found in this local report. The timing makes sense as Tucson was rapidly urbanized around then with population growing by astonishing 368% in the 1960’s (Exhibit 2).
Exhibit 1 – Average Temperatures
Source: NOAA/National Weather Service, Tucson Arizona
Exhibit 2 – Tucson Population Growth by Decade
Source: Wikipedia
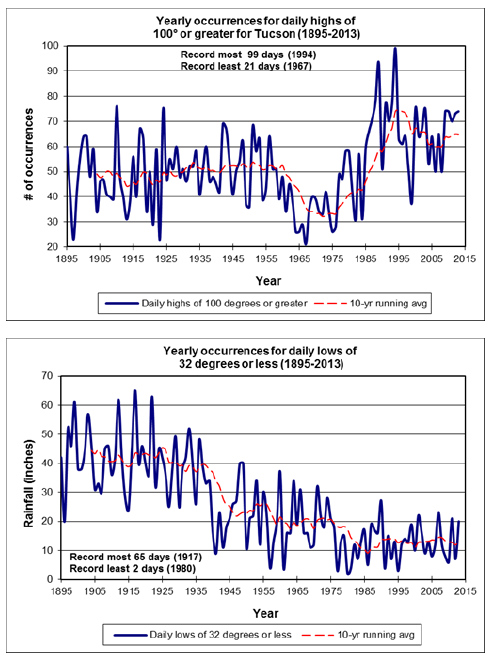
Another trend I found interesting is the data on occurrences of 100+ degree days (Exhibit 2). This unpleasant (for most of us?) side-effect of living in the desert became more pronounced lately. In the past ten years we averaged about 65 such days a year, up from 50 or so a century ago. It’s not all bad though, as there has been a corresponding decrease in days below freezing point (panel 2). Personally, I could do with even fewer frost days so I don’t have to cover all my plants with sheets and blankets!
Exhibit 3 – Occurrences of Extreme High and Low Temperatures
Source: NOAA/National Weather Service, Tucson Arizona
Conclusion
This was just a quick post highlighting local climate trends I personally found interesting. There is a plethora of very cool and interesting Tucson climate data available on the NOAA website.
You can see a pdf with annual data including full set of charts and record tables here:
http://www.wrh.noaa.gov/twc/climate/PDFs/Yearly.pdf
Or even more detailed data by month, season, etc here (click on season link for pdf):


